Observability
Grafana
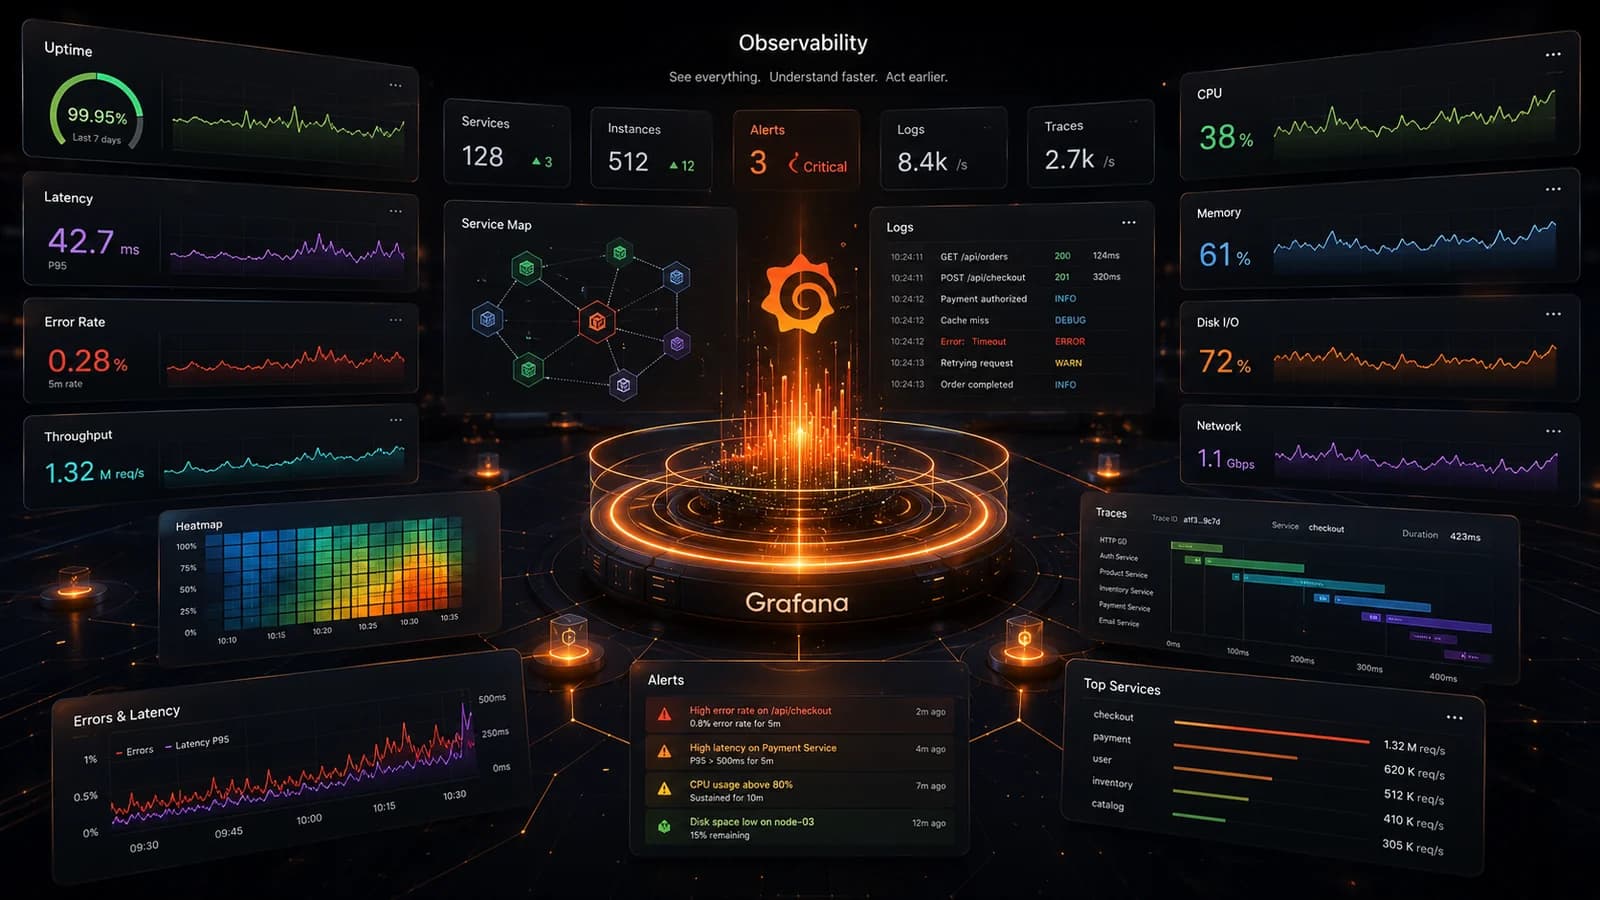
Grafana is where we watch the health of a system — metrics and logs in dashboards that make problems visible early.
What it is
Grafana visualises metrics, logs, and traces from across a system in dashboards and alerts. It connects to many data sources to give one view of how things are running.
Why we use it
You can’t improve what you can’t see. Grafana gives us and our clients a shared, honest view of uptime, latency, and load — so decisions about the second year are made on data.
Where we put it to work
In the product,
not the slide.
01
Health dashboards
Uptime, latency, and load in one place the whole team can read.
02
Alerting
Thresholds that warn before a slow trend becomes an outage.
03
Capacity planning
Trends over time that show when to scale before users feel it.